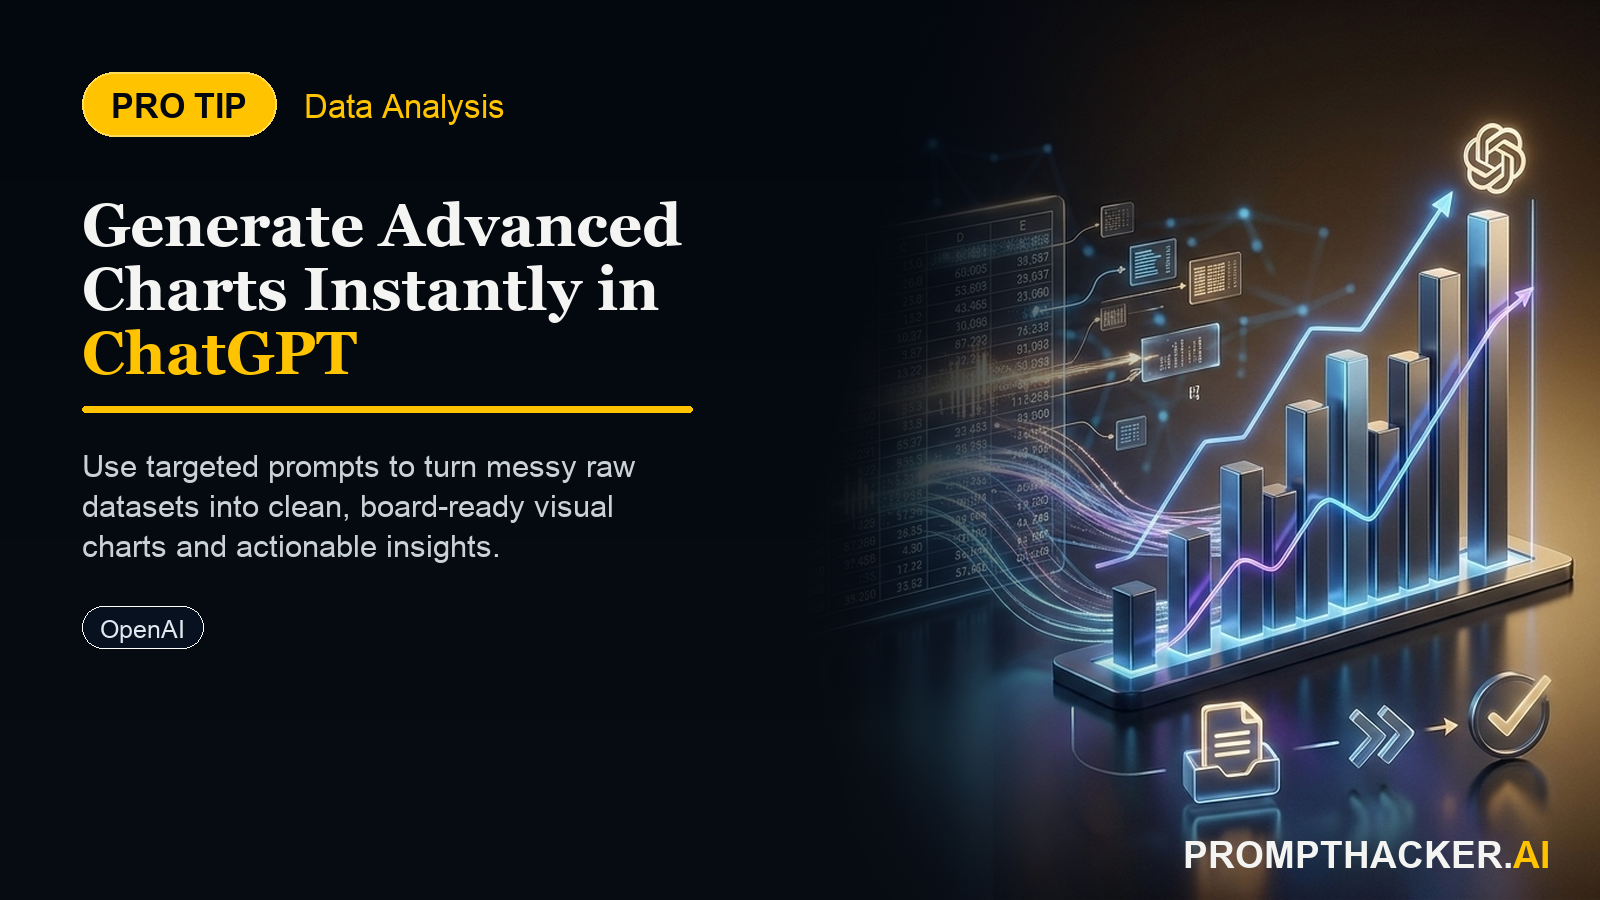
ChatGPT Generates Advanced Charts for Faster Data Insights
OpenAI ChatGPT now generates more complex and customizable charts from uploaded data, saving 60 minutes per report preparation and improving insights.
What matters today
OpenAI ChatGPT now generates more complex and customizable charts from uploaded data, saving 60 minutes per report preparation and improving insights.
Key points
- Step 1: Upload Sales or Operational Data to ChatGPT
- Step 2: Request Specific Chart Types to Visualize Trends
- Step 3: Customize Chart Parameters for Deeper Insights
What you will learn in this article:
- How to upload and analyze diverse datasets in ChatGPT for immediate insights.
- How to request and customize advanced chart types to visualize complex trends.
- How to refine generated charts to meet specific reporting and presentation needs.
- How to export high-quality visuals for reports, reducing reliance on external tools.
- How to save 60 minutes per report preparation by streamlining data visualization.
A marketing director at a rapidly growing e-commerce company faces a familiar challenge. An urgent board meeting requires a comprehensive visualization of Q3 campaign performance, including customer acquisition costs, conversion rates across different channels, and lifetime value projections. Their dedicated data analyst is currently on a two-week leave, and the usual business intelligence tools require several hours of setup for ad-hoc, multi-dimensional reporting. The director needs to synthesize complex data into clear, actionable charts within a tight deadline, without the luxury of specialized software expertise or extensive manual work.
Failing to deliver accurate and visually compelling data for such a critical meeting can lead to misinformed strategic decisions, delayed budget allocations, and a missed opportunity to secure crucial funding for future campaigns. Without immediate access to clear performance trends and forecasts, the board may question the efficacy of current strategies, impacting the company's growth trajectory and investor confidence. The pressure to quickly transform raw data into a coherent narrative is immense, and traditional methods often prove too slow or resource-intensive for these high-stakes, last-minute demands.
This article details how executives can leverage OpenAI ChatGPT's enhanced data analysis and chart generation capabilities to overcome such challenges. It provides a structured approach for uploading complex datasets, requesting specific visualizations, and customizing charts to extract immediate, actionable insights. Discover how to streamline your reporting workflows, reduce reliance on specialized tools, and save significant time on critical data presentations, ensuring that strategic decisions are always informed by the most current and visually compelling information available.
Executives frequently encounter situations requiring rapid data visualization to inform critical decisions. The enhanced chart generation capabilities within OpenAI ChatGPT, released on October 26, 2025, directly address this need. This update allows users to create sophisticated, customizable charts directly from uploaded data, eliminating the manual effort and specialized software traditionally required for such tasks. The result is a significant time saving, estimated at 60 minutes per report preparation, and a faster path to valuable business insights.
The core value proposition for executives lies in the ability to move from raw data to compelling visual narratives with unprecedented speed. This capability reduces bottlenecks associated with data analysis, allowing for more agile responses to market changes, internal performance fluctuations, and strategic inquiries. By following a systematic approach, any executive can harness this tool to elevate their data-driven decision-making.
Step 1: Upload Sales or Operational Data to ChatGPT
The first step in leveraging ChatGPT's enhanced charting capabilities involves uploading the relevant dataset. ChatGPT supports various file formats, including CSV, Excel spreadsheets (XLSX), and JSON. For optimal results, ensure your data is clean, well-structured, and clearly labeled. This foundational step dictates the quality and accuracy of subsequent visualizations.
- Preparing Your Data: Before uploading, review your dataset for consistency. Ensure column headers are descriptive, data types are uniform (e.g., all numbers in a numeric column), and there are no missing values that could skew analysis. For instance, if analyzing sales data, verify that product names, quantities, and revenue figures are correctly formatted. A clean dataset minimizes the need for iterative corrections and ensures ChatGPT interprets the data accurately.
- The Upload Process: Access ChatGPT and locate the data upload icon, typically represented by a paperclip or a plus symbol. Select your file from your local drive. Once uploaded, ChatGPT will often provide a brief summary of the dataset, including column names and a few sample rows. This summary confirms successful upload and provides an initial overview of the data structure.
- Initial Context Prompt: After uploading, provide an initial prompt to give ChatGPT context about your data. This helps the AI understand the purpose of your analysis. For example, "Analyze this dataset containing Q3 sales performance. The columns represent product categories, units sold, revenue, and customer demographics." This establishes the scope and prepares ChatGPT for specific visualization requests.
Example Prompt
"Analyze this dataset containing Q3 sales performance. The columns represent product categories, units sold, revenue, and customer demographics."
- Real-world Business Scenario: Inventory Management: Consider a Vice President of Operations needing to quickly assess inventory turnover rates across multiple warehouses. They upload a CSV file containing daily inventory levels, sales volumes, and reorder points for hundreds of SKUs. Without a clear initial prompt, ChatGPT might not understand the relationships between these columns. By providing context like, "This data tracks inventory movement. Help me identify slow-moving items and optimize reorder points," the VP sets the stage for a targeted analysis. This proactive step saves time by guiding the AI toward relevant insights from the outset.
Example Prompt
"This data tracks inventory movement. Help me identify slow-moving items and optimize reorder points,"
Step 2: Request Specific Chart Types to Visualize Trends
Once data is uploaded and context is provided, you can request specific chart types to visualize trends, patterns, and anomalies. ChatGPT's enhanced capabilities allow for a wide range of chart options, from basic bar and line graphs to more complex scatter plots, heatmaps, and pivot tables. The key is to articulate your visualization needs clearly.
- Formulating Effective Chart Requests: Be precise in your prompts. Instead of a vague request like "Show me sales data," specify "Generate a bar chart comparing total revenue across product categories for Q3." If you need to observe trends over time, request "Create a line graph showing monthly revenue growth from January to September." For relationship analysis, "Produce a scatter plot showing the correlation between advertising spend and sales volume."
Example Prompts
"Show me sales data,"
"Generate a bar chart comparing total revenue across product categories for Q3."
"Create a line graph showing monthly revenue growth from January to September."
"Produce a scatter plot showing the correlation between advertising spend and sales volume."
- Leveraging Data Attributes: Refer to specific column names from your uploaded data in your requests. For example, if your data includes "Gross Profit" and "Region," you might ask, "Display a pie chart showing the distribution of Gross Profit by Region." This direct reference minimizes ambiguity and ensures the correct data points are used for visualization.
Example Prompt
"Display a pie chart showing the distribution of Gross Profit by Region."
- Exploring Complex Visualizations: ChatGPT can handle more advanced requests. For instance, if you have multiple variables and want to understand their interplay, you could request, "Generate a stacked bar chart showing sales volume by product category, segmented by customer demographic (e.g., age group)." This allows for multi-dimensional analysis within a single visual.
Example Prompt
"Generate a stacked bar chart showing sales volume by product category, segmented by customer demographic (e.g., age group)."
- Troubleshooting Initial Outputs: Sometimes, the first chart generated may not perfectly capture the desired insight. This is an opportunity for refinement. If a bar chart is too cluttered, you might follow up with, "Can you group the smaller categories into 'Other'?" or "Recreate this as a horizontal bar chart for better readability." This iterative process is crucial for achieving optimal visualization.
Example Prompts
"Can you group the smaller categories into 'Other'?"
"Recreate this as a horizontal bar chart for better readability."
Step 3: Customize Chart Parameters for Deeper Insights
The ability to customize generated charts is where ChatGPT truly shines, enabling executives to refine visualizations for deeper insights and specific reporting requirements. This goes beyond basic chart types, allowing adjustments to colors, labels, axes, and even data filtering directly within the conversation.
- Refining Visual Aesthetics: Visual clarity is paramount for executive presentations. You can request specific color palettes to align with company branding or to highlight critical data points. For example, "Change the color of the 'Underperforming Products' bars to red and 'High-Performing Products' to green." You can also adjust labels: "Add data labels to each bar showing the exact revenue figures" or "Change the x-axis label from 'Prod_Cat' to 'Product Category'."
Example Prompts
"Change the color of the 'Underperforming Products' bars to red and 'High-Performing Products' to green."
"Add data labels to each bar showing the exact revenue figures"
"Change the x-axis label from 'Prod_Cat' to 'Product Category'."
- Adjusting Axes and Scales: The scale and range of axes significantly impact how trends are perceived. If a chart's automatic scaling obscures subtle changes, you can instruct ChatGPT: "Set the y-axis to start from $50,000 to better highlight variations in revenue," or "Use a logarithmic scale for the sales volume to show proportional changes." This level of control ensures the visual accurately represents the data's nuances.
Example Prompts
"Set the y-axis to start from $50,000 to better highlight variations in revenue,"
Three deep dives. Four useful moves. One email worth opening.
PromptHacker turns the AI firehose into practical next steps for work, health, family, and everything time keeps trying to steal.